1) Download and install Anaconda: https://www.anaconda.com/
2) Select an event of interest, for example the following and write down it’s Origin Time. In this case it is: 08/06/2023, 12:33:54.29
3. Launch Anaconda Navigator, create a new virtual environment with Python3 version 3.10 or newer and start it.
4. Launch a terminal inside the virtual environment and install obspy writting:
pip install obspy
5. Enable Spyder Python editor in the Anaconda and launch it:
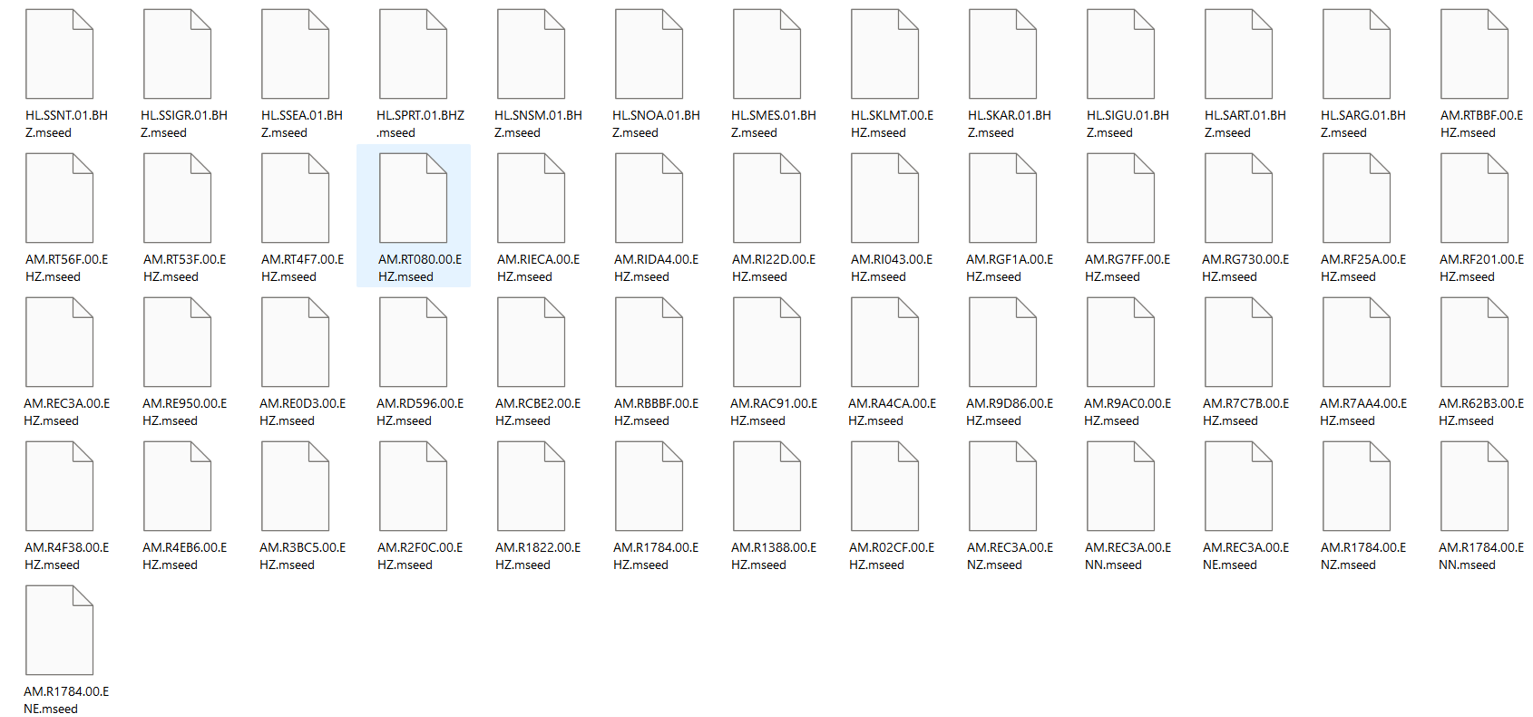
- Copy paste and run the following code. Adjust the output directory to yours. The python3 code will fetch all data for a specific earthquake (you can set your own), according to it’s origin time. It creates a directory where all the data will be saved and it will also create their plots.
from obspy.clients.fdsn import Client
from obspy import UTCDateTime
from obspy import read_inventory
from datetime import datetime
import sys
import os
#########################################################
# EDIT HERE
# We define the SEISMO-LAB FDSNWS ADDRESS:
client = Client(“http://seismolab.gein.noa.gr:8080”)
# We define the output directory (put double “\\” instead of “\”)
outdir = ‘C:\\Users\\kbouk\\Documents\\seismolab\\’
# We define the Origin Time of the event of interest:
ot = “2023-06-08T12:31:00.000”
#########################################################
# Set a station list stating date and create corresponding folder
t = UTCDateTime(ot)
starttime = UTCDateTime(“2017-01-01T00:00:00.000”)
d = ot.split(“T”)
otime=d[1].replace(“:”, “”)
evdir = outdir+d[0]+”_”+otime
if not os.path.exists(evdir):
os.makedirs(evdir)
# Set station end time as current date.
t2 = datetime.utcnow()
# Get all stations for SEISMO-LAB FDSNWS
inventory = client.get_stations(network=”*”, station=”*”,
starttime=starttime,
endtime=t2,
level=”channel”)
# Save event data for all available SEISMO-LAB Stations and create a plot
sta=””
for k, v in sorted(inventory.get_contents().items()):
if k==”channels”:
for i in sorted(v):
x = i.split(“.”)
network=x[0]
station=x[1]
location=x[2]
channel=x[3]
#print(network+”,”+location+”,”+station+”,”+channel)
if sta != station:
try:
st = client.get_waveforms(network, station, location, channel, t, t + 10 * 60)
print(st)
filename = network+”.”+location+”.”+station+”.”+channel+”_”+ot+”.mseed”
for tr in st:
tr.write(evdir+”/”+tr.id+”.mseed”, format=”MSEED”)
print(network+”,”+location+”,”+station+”,”+channel)
st.plot(outfile=evdir+”/”+tr.id+”.png”)
sta=station
except Exception:
continue
As a result we’ll get all the earthquake plots and data of the available stations.


